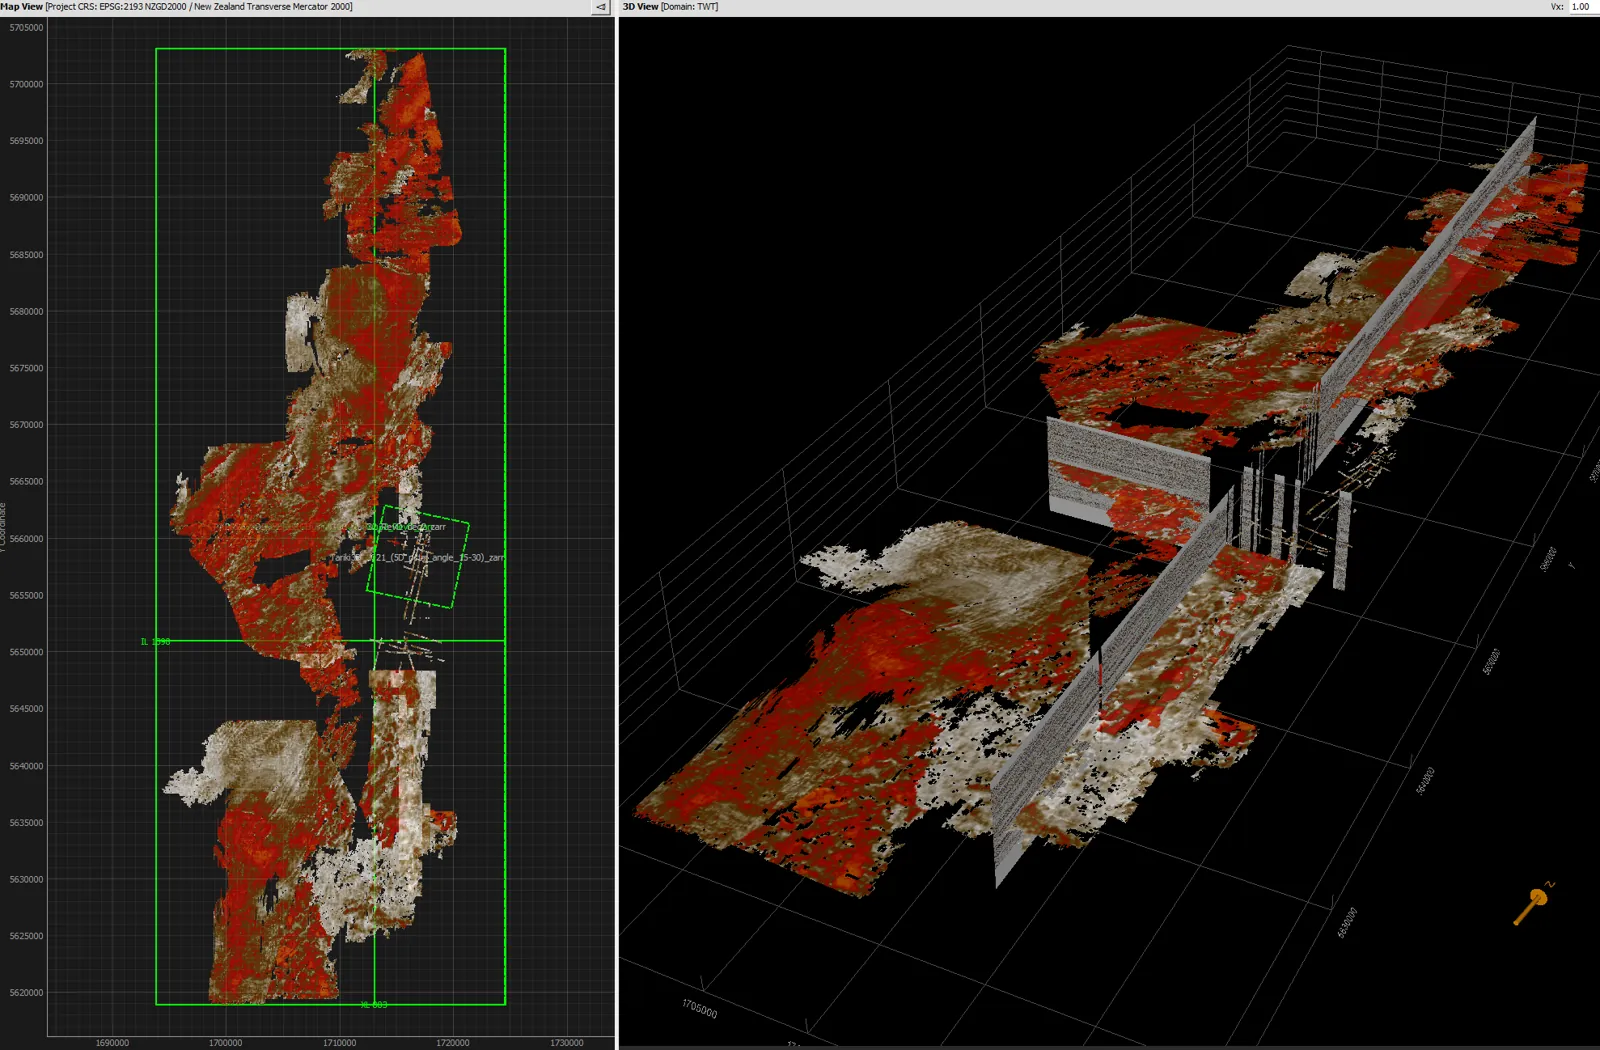
One volume. Every survey. Full resolution.
SeisMomentum’s proprietary workflow merges any number of 3D seismic surveys and 2D lines into a single 3D volume. Each input keeps the resolution and character of its own optimised processing, and the result is ready for basin-to-prospect-scale interpretation.
Reservoirs sit within basins
Understanding a reservoir’s architecture needs regional-scale knowledge of its palaeogeography, and individual 3D surveys are usually too small for that. Most interpretation platforms also work on one survey at a time.
Merging is hard because every 3D survey has its own grid origin, bin spacing, rotation, datum, record length and sample rate. The traces all have to be moved onto one common grid without losing detail. Standard merging often leads to:
- pixelated secondary volumes and gridding artefacts in slice view
- cycle skips and loss of amplitude character
- over- or under-balanced amplitudes between surveys
- 2D lines left out of 3D interpretation workflows
High-fidelity post-stack merging
We start from each survey as it was optimally processed for its own objectives. There’s no single compromise processing sequence and no months-long reprocessing project.
- Survey matching in Solarium™: polygon cropping to each survey’s best data, amplitude scaling, redatuming and TWT shifts, polarity and phase matching, and spectral matching.
- Re-gridding and merging: proprietary frequency-domain interpolation and re-gridding, integrated with the open-source Seismic Un*x package.
- 2D into 3D: 2D lines can be widened sideways (for example to reach nearby wells) and mitred at intersections to help auto-tracking.
The outcome is one SEG-Y volume that you can load into Petrel, tNavigator, PaleoScan and other platforms. From it you can draw arbitrary lines across 3D and 2D data, extract full-volume attributes, and build basin-scale grids and models.
The workflow is built for interpretation projects. It can handle many input volumes, and it’s quick to add or replace a dataset or produce different versions of the merge.
| Option | Strengths | Weaknesses |
|---|---|---|
| Full reprocessing and merging | Consistent merged 3D dataset | Months; highest cost; one processing sequence applied to all inputs regardless of acquisition design and S/N |
| Pre-stack remigration to a common grid | Consistent merged 3D dataset; uses individually-processed inputs | Weeks; high cost |
| Post-stack nearest-neighbour trace borrowing | Very fast; very low cost | Aliasing, trace repetition and Moiré artefacts that can rule out attribute interpretation |
| Post-stack distance-weighted averaging | Fast (days); low cost | Similar artefacts; reduced sensitivity of edge-detection and curvature attributes |
| SeisMomentum frequency-domain interpolation and re-gridding | Fast (days); cost-effective; uses individually-processed inputs; includes 2D and 3D data; fits 3D interpretation workflows | Interpolation parameters need careful fine-tuning (we handle this) |
Kaka and Maui 3D surveys, merged at full resolution
The Maui 3D was re-gridded onto the Kaka 3D grid, which has a different orientation, and the polarity was reversed to match. The original resolution is kept across the merge boundary.
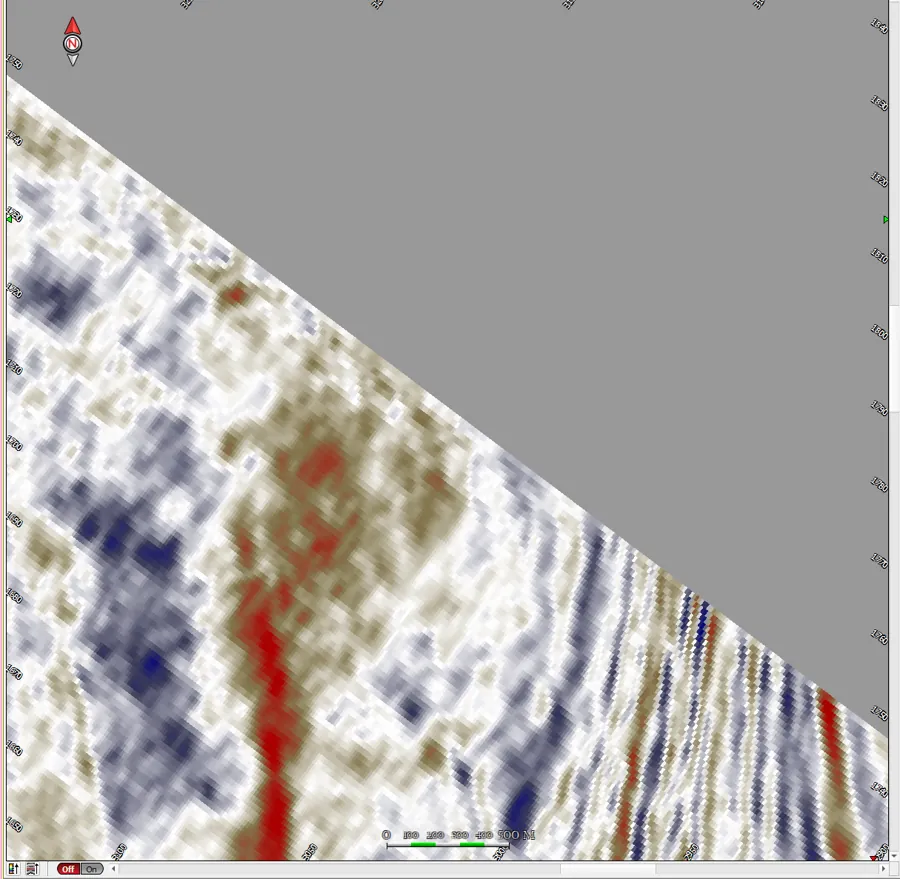
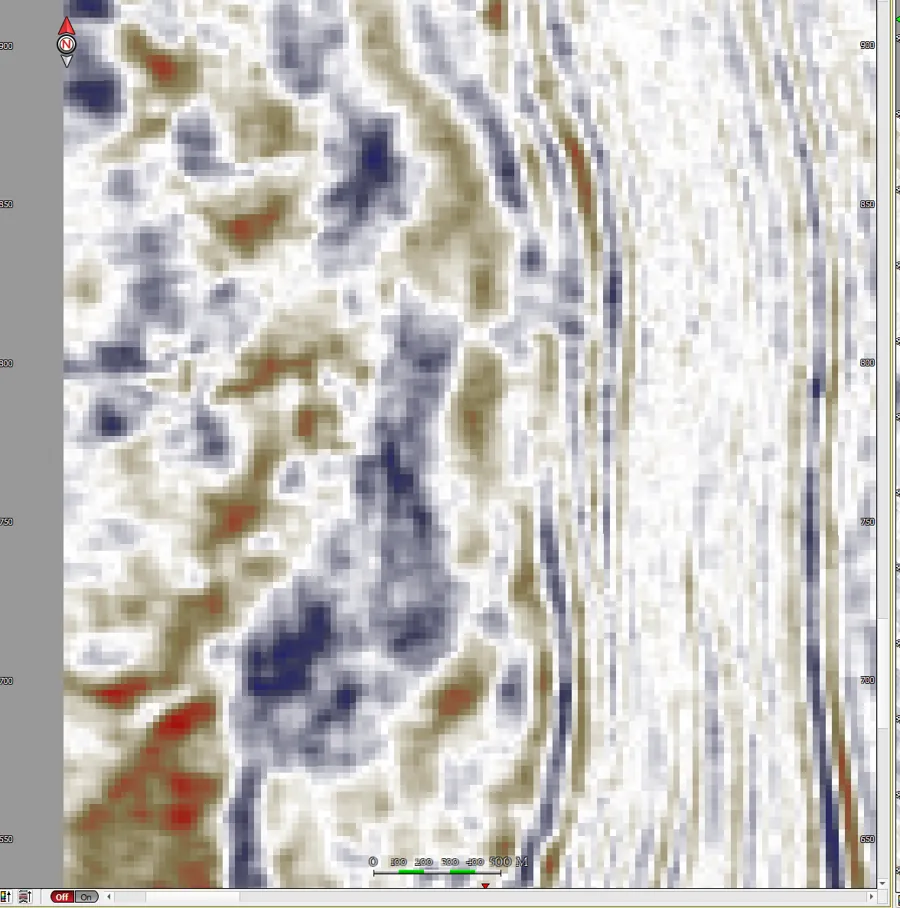
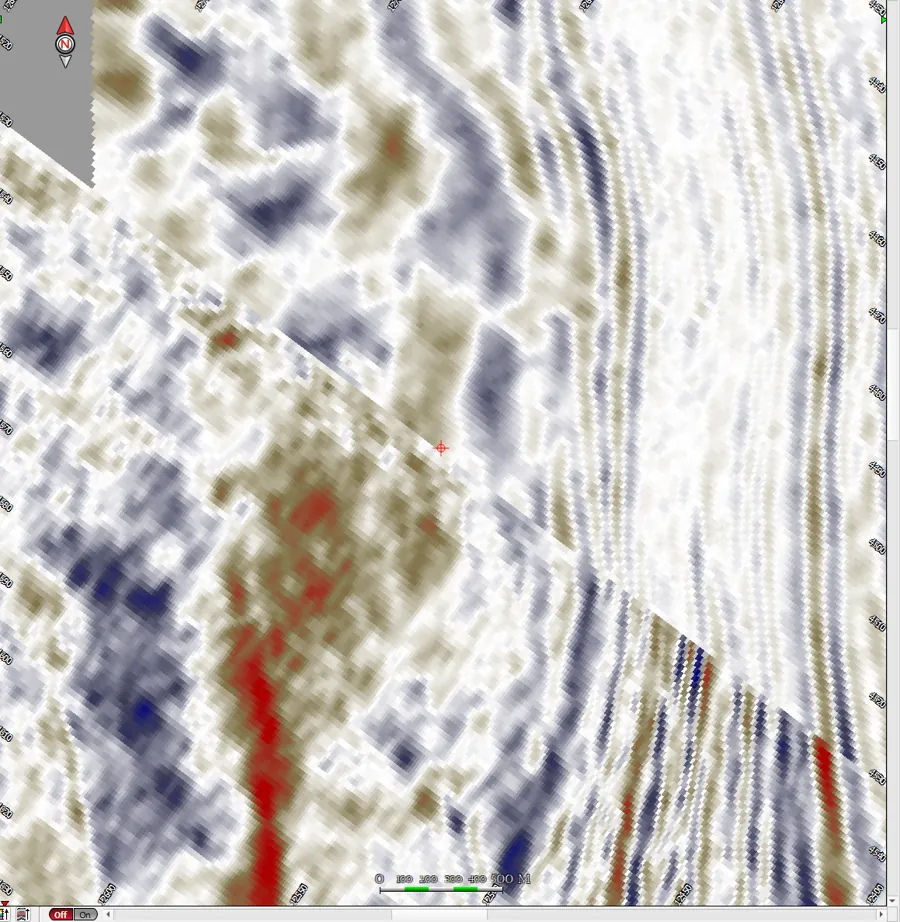
Input data are publicly available from New Zealand Petroleum & Minerals.
Merging a dense 2D grid
Two 3D volumes and the 35-line STOS95 2D survey were merged into a single 3D volume without any pre-conditioning other than amplitude scaling and polarity matching, and without any post-processing.
This supports fast 3D interpretation, attribute extraction across the whole volume (such as spectral decomposition), and gridding and model building in tools such as PaleoScan.
Spectral decomposition has been performed on the merged 2D-to-3D volume using Eliis’s PaleoScan software.
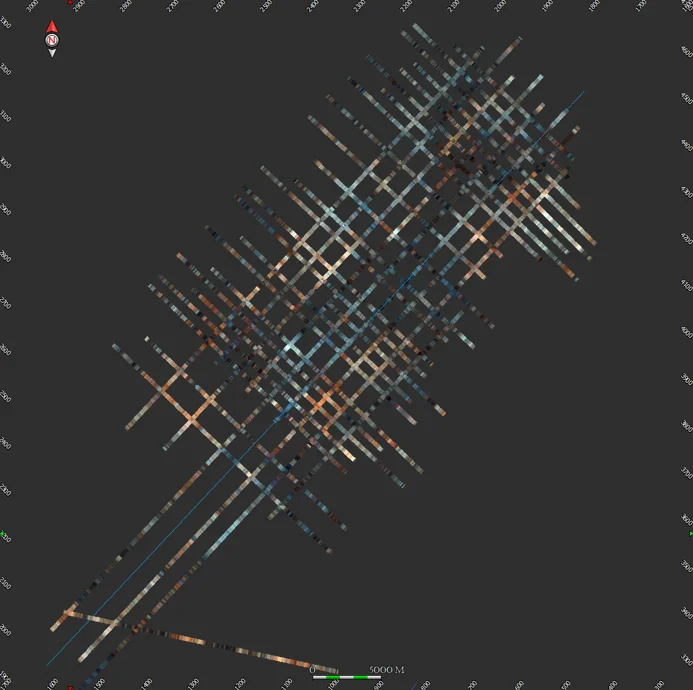
Taranaki Panorama 3D
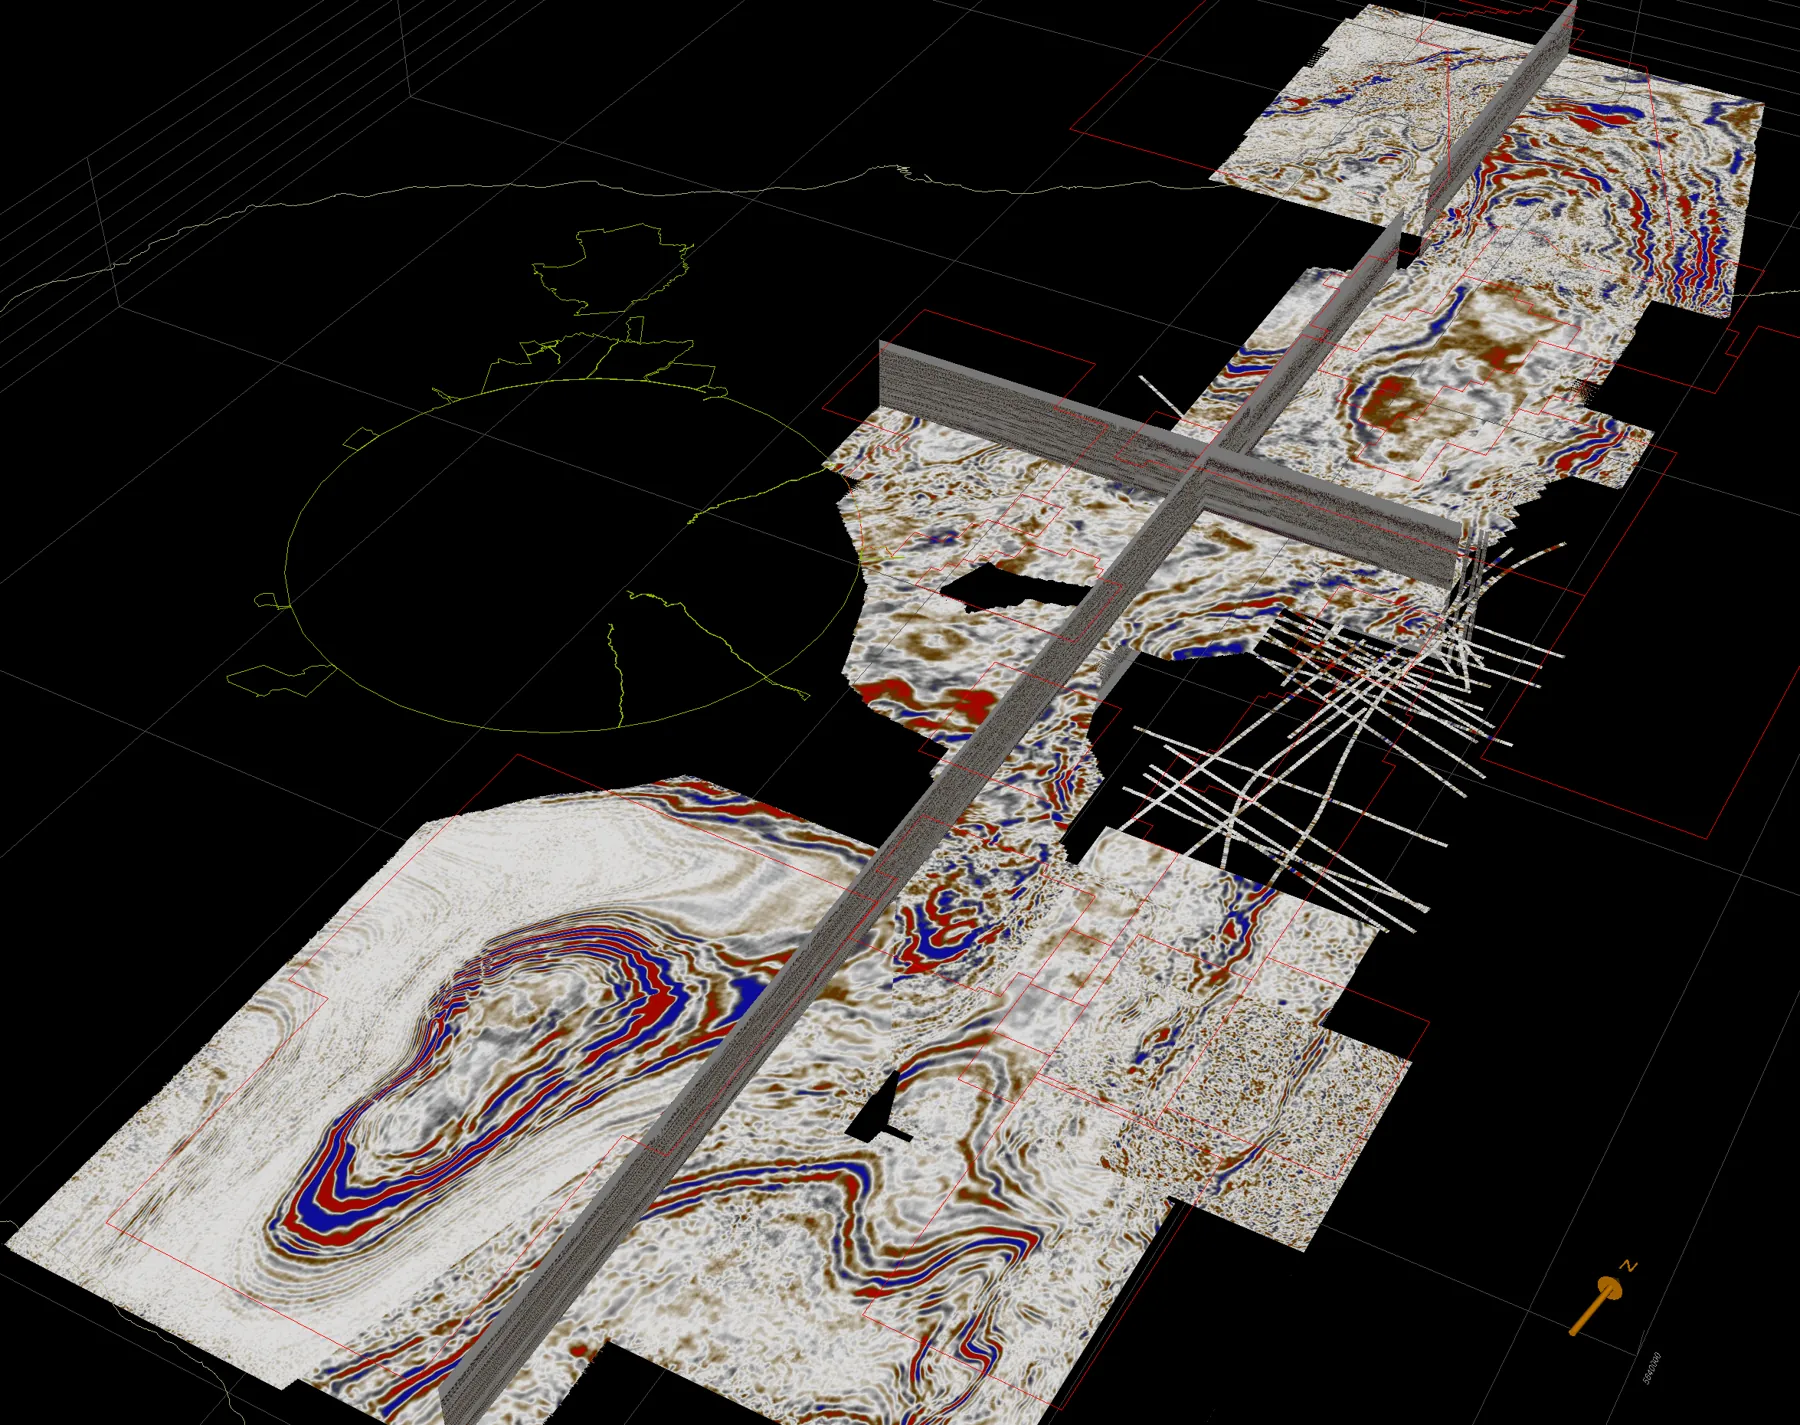
Ten 3D volumes and 33 2D lines from the NZ GeoData catalogue were merged into one volume. It runs from the south coast of the Taranaki peninsula to the northern end of the Pohokura 3D and is available for licensing.
It supports new exploration, gas storage and CCS evaluations, and training in seismic sequence stratigraphy.